
Parametric Equations
by:
Brandt Hacker
A parametric equation is one that defines the coordinates
for x and y using some other parameter.
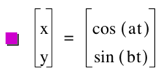
For instance, if we set x = f(t) and y = g(t), then the parametric
equation would be the relationship between t and functions f and g graphed in a
plane. For the following problems
the value of t will be limited by the inequality ![]() .
.
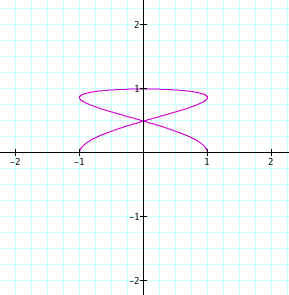
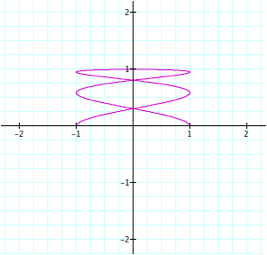
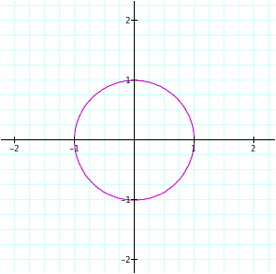
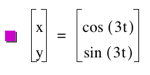
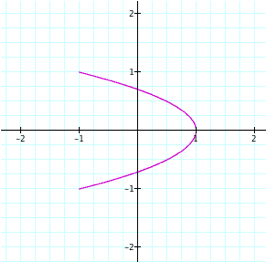
In assignment 10 we will look to see how various values of a and b change the parametric equation of the of the form seen below. The graph below sets both a and b equal to 1.
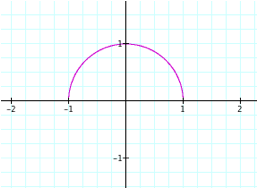
![]()
In the graph above it appears that the zeros occur at 1 and
-1, but these are merely the x-values and y-values that correspond to some time
t. Because our parameters were set
for ![]() , the x-intercepts actually represent the times at which our
function y = sin(t) = 0.
, the x-intercepts actually represent the times at which our
function y = sin(t) = 0.
We will now look at what happens to the graph as we vary a and b.
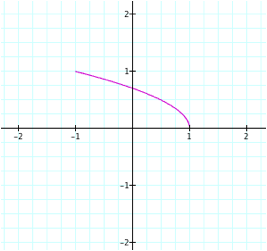
Below are graphs of different parametric equations of the same form with varying values of a and b.
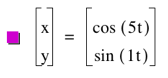
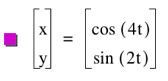
There are a variety of interesting relationships as we change the values of a and b in the parametric equation. One such relationship can be seen as we observe what happens when a=b.
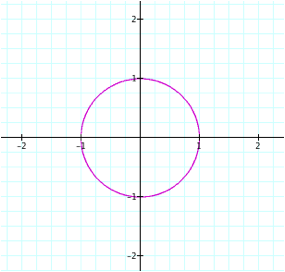
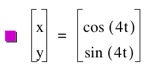
It appears from the three graphs above that whenever a=b, the resulting parametric equation is a circle.
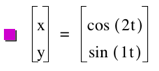
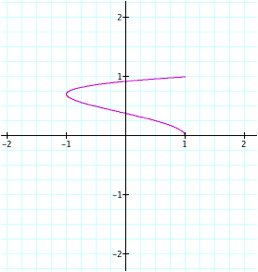
Let’s now look at another interesting set of parametric equations.
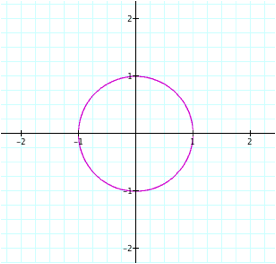

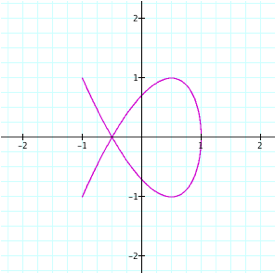
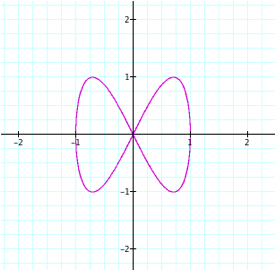
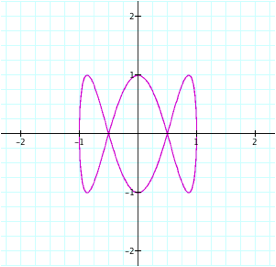
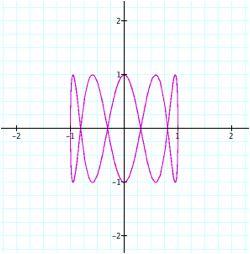
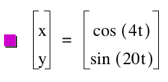
In the images above we see that the graph is symmetric over the x-axis when the coefficient of b is divisible by the coefficient of a. The other trend that we see developing is that the number of enclosed regions in the image is equal to b/a. In other words, in the equations above, a = 4 and b = 20, since 20/4 = 5, the graph should have 5 enclosed regions. It does. Notice that this was not the case when a = 4 and b = 6, the second graph in this set.